Are you looking for a solid swing trading opportunity? We’ve spotted a potential gem in ANGELONE that you won’t want to miss! Let’s dive into the charts and break down why this trade setup is looking promising across multiple timeframes.
Weekly Chart: Bullish Breakout

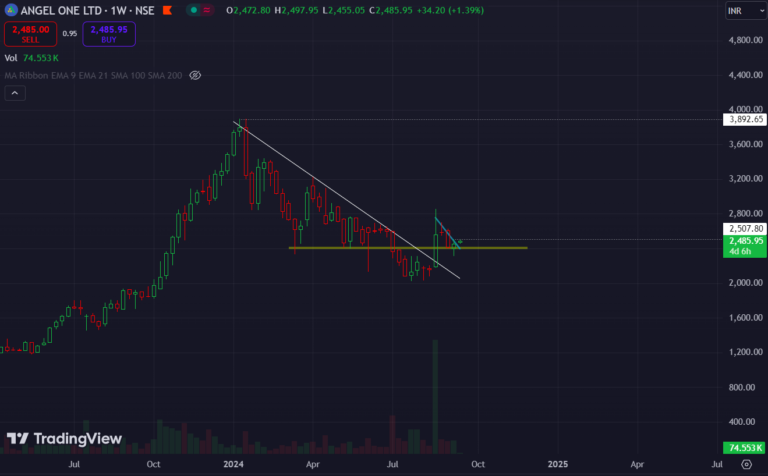
On the weekly chart, ANGELONE has broken through a long-standing trendline, which signals strong bullish momentum on a larger timeframe. This breakout is often a key indicator that the stock is preparing for a larger move upward, making it an ideal candidate for swing traders like us.
Daily Chart: Key Support Zone at ₹2400

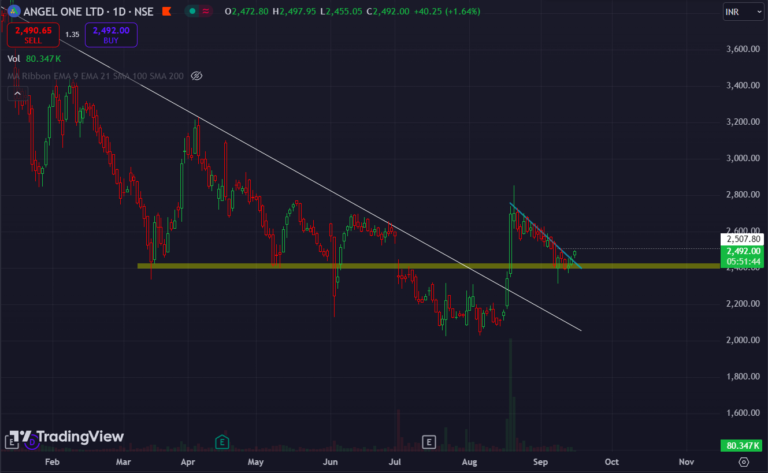
Now, zooming into the daily chart, we can see that ANGELONE is currently sitting at its support level of ₹2400—a level the stock has tested several times before. This area is also a polarity zone, where previous resistance has now turned into support, which adds even more value to this level.
Additionally, the EMA 9 is above the EMA 21, a clear sign that bullish sentiment is still in play. When combined with the support at ₹2400, it strengthens the case for a potential bounce from this level.
Hourly Chart: Double Bottom Confirmation

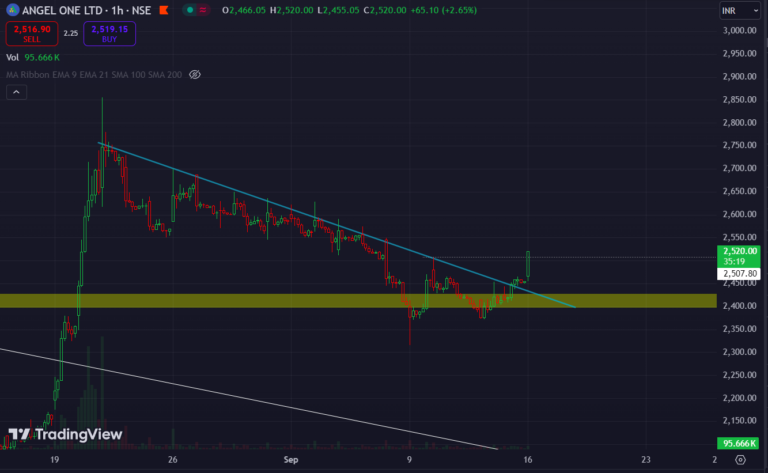
On the hourly chart, we can see a double bottom pattern forming, which is a reliable reversal signal. However, patience is key here! We’ll only look to enter this trade once the price breaks above ₹2510 and closes above that level, confirming the double bottom.
Trade Setup
- Entry Price: ₹2510 (After a close above this level)
- Stop Loss: ₹2300 (Below key support level)
- Target: ₹3140 (Or more, depending on market conditions)
This setup gives us an excellent risk-to-reward ratio of 1:3, which is ideal for swing trading. It’s important to wait for the proper entry confirmation to ensure the trade aligns with our strategy.
Key Points Recap:
- Trendline breakout on the weekly chart = bullish momentum.
- Strong support level at ₹2400 on the daily chart, plus EMA 9 above EMA 21.
- Double bottom on the hourly chart, with entry after a break and close above ₹2510.
Disclaimer:
Trading in the stock market involves risk, and there are no guarantees of profit. This analysis is for informational purposes only. Always consult with a certified financial advisor before making any trading decisions.

